Generate Datasets in Python
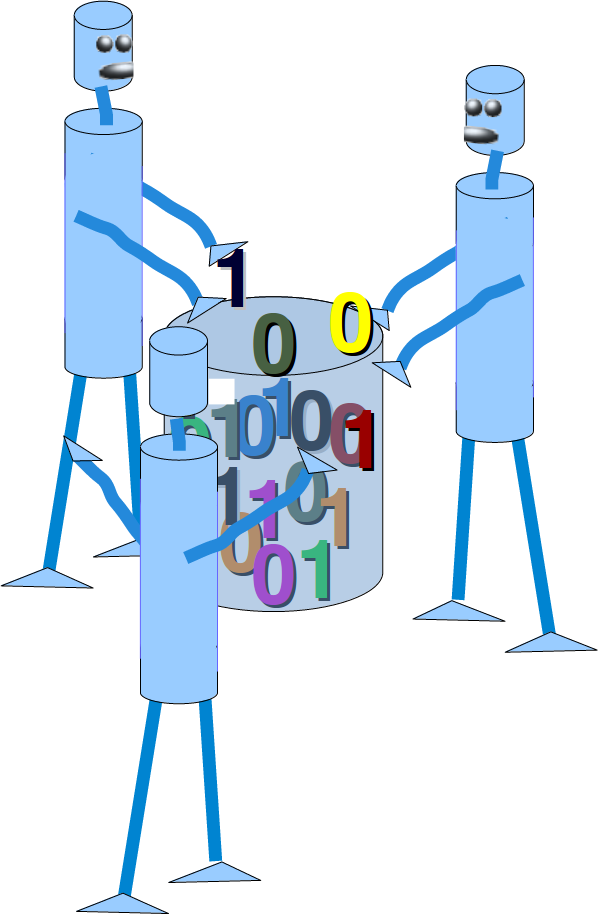
A problem with machine learning, especially when you are starting out and want to learn about the algorithms, is that it is often difficult to get suitable test data. Some cost a lot of money, others are not freely available because they are protected by copyright. Artificial test data can be a solution in some cases.
For this reason, this chapter of our tutorial deals with the artificial generation of data. This chapter is about creating artificial data. In the previous chapters of our tutorial we learned that Scikit-Learn contains different data sets. On the one hand, there are small toy data sets, but it also offers larger data sets that are often used in the machine learning community to test algorithms or also serve as a benchmark. It provides us with data coming from the 'real world'. The sklearn.datasets package embeds some small toy records as described in the Getting Started section.
In addition, scikit-learn includes various random sample generators that can be used to create artificial datasets of controlled size and complexity.
The following Python code is a simple example in which we create artificial weather data for some German cities. We use Pandas and Numpy to create the data:
import numpy as np
import pandas as pd
cities = ['Berlin', 'Frankfurt', 'Hamburg',
          'Nuremberg', 'Munich', 'Stuttgart',
          'Hanover', 'Saarbruecken', 'Cologne',
          'Constance', 'Freiburg', 'Karlsruhe'
         ]
n= len(cities)
data = {'Temperature': np.random.normal(24, 3, n),
        'Humidity': np.random.normal(78, 2.5, n),
        'Wind': np.random.normal(15, 4, n)
       }
df = pd.DataFrame(data=data, index=cities)
df
Another Example
We will create artificial data for four nonexistent types of flowers:
- Flos Pythonem
- Flos Java
- Flos Margarita
- Flos artificialis
The RGB avarage colors values are correspondingly:
- (255, 0, 0)
- (245, 107, 0)
- (206, 99, 1)
- (255, 254, 101)
The avarage diameter of the calyx is:
- 3.8
- 3.3
- 4.1
- 2.9
import matplotlib.pyplot as plt
import numpy as np
import pandas as pd
from scipy.stats import truncnorm
def truncated_normal(mean=0, sd=1, low=0, upp=10, type=int):
    return truncnorm(
        (low - mean) / sd, (upp - mean) / sd, loc=mean, scale=sd)
def truncated_normal_floats(mean=0, sd=1, low=0, upp=10, num=100):
    res = truncated_normal(mean=mean, sd=sd, low=low, upp=upp)
    return res.rvs(num)
def truncated_normal_ints(mean=0, sd=1, low=0, upp=10, num=100):
    res = truncated_normal(mean=mean, sd=sd, low=low, upp=upp)
    return res.rvs(num).astype(np.uint8)
# number of items for each flower class:
number_of_items_per_class = [190, 205, 230, 170]
flowers = {}
# flos Pythonem:
number_of_items = number_of_items_per_class[0]
reds = truncated_normal_ints(mean=254, sd=18, low=235, upp=256,
                             num=number_of_items)
greens = truncated_normal_ints(mean=107, sd=11, low=88, upp=127,
                             num=number_of_items)
blues = truncated_normal_ints(mean=0, sd=15, low=0, upp=20,
                             num=number_of_items)
calyx_dia = truncated_normal_floats(3.8, 0.3, 3.4, 4.2,
                             num=number_of_items)
data = np.column_stack((reds, greens, blues, calyx_dia))
flowers["flos_pythonem"] = data
# flos Java:
number_of_items = number_of_items_per_class[1]
reds = truncated_normal_ints(mean=245, sd=17, low=226, upp=256,
                             num=number_of_items)
greens = truncated_normal_ints(mean=107, sd=11, low=88, upp=127,
                             num=number_of_items)
blues = truncated_normal_ints(mean=0, sd=10, low=0, upp=20,
                             num=number_of_items)
calyx_dia = truncated_normal_floats(3.3, 0.3, 3.0, 3.5,
                             num=number_of_items)
data = np.column_stack((reds, greens, blues, calyx_dia))
flowers["flos_java"] = data
# flos Java:
number_of_items = number_of_items_per_class[2]
reds = truncated_normal_ints(mean=206, sd=17, low=175, upp=238,
                             num=number_of_items)
greens = truncated_normal_ints(mean=99, sd=14, low=80, upp=120,
                             num=number_of_items)
blues = truncated_normal_ints(mean=1, sd=5, low=0, upp=12,
                             num=number_of_items)
calyx_dia = truncated_normal_floats(4.1, 0.3, 3.8, 4.4,
                             num=number_of_items)
data = np.column_stack((reds, greens, blues, calyx_dia))
flowers["flos_margarita"] = data
# flos artificialis:
number_of_items = number_of_items_per_class[3]
reds = truncated_normal_ints(mean=255, sd=8, low=2245, upp=2255,
                             num=number_of_items)
greens = truncated_normal_ints(mean=254, sd=10, low=240, upp=255,
                             num=number_of_items)
blues = truncated_normal_ints(mean=101, sd=5, low=90, upp=112,
                             num=number_of_items)
calyx_dia = truncated_normal_floats(2.9, 0.4, 2.4, 3.5,
                             num=number_of_items)
data = np.column_stack((reds, greens, blues, calyx_dia))
flowers["flos_artificialis"] = data
data = np.concatenate((flowers["flos_pythonem"],
                      flowers["flos_java"],
                      flowers["flos_margarita"],
                      flowers["flos_artificialis"]
                     ), axis=0)
# assigning the labels
target = np.zeros(sum(number_of_items_per_class)) # 4 flowers
previous_end = 0
for i in range(1, 5):
    num = number_of_items_per_class[i-1]
    beg = previous_end
    target[beg: beg + num] += i
    previous_end = beg + num

conc_data = np.concatenate((data, target.reshape(target.shape[0], 1)),
                           axis=1)
np.savetxt("data/strange_flowers.txt", conc_data, fmt="%2.2f",)
import matplotlib.pyplot as plt
target_names = list(flowers.keys())
feature_names = ['red', 'green', 'blue', 'calyx']
n = 4
fig, ax = plt.subplots(n, n, figsize=(16, 16))
colors = ['blue', 'red', 'green', 'yellow']
for x in range(n):
    for y in range(n):
        xname = feature_names[x]
        yname = feature_names[y]
        for color_ind in range(len(target_names)):
            ax[x, y].scatter(data[target==color_ind, x],
                             data[target==color_ind, y],
                             label=target_names[color_ind],
                             c=colors[color_ind])
        ax[x, y].set_xlabel(xname)
        ax[x, y].set_ylabel(yname)
        ax[x, y].legend(loc='upper left')
plt.show()
from sklearn.datasets import make_blobs
import matplotlib.pyplot as plt
import numpy as np
data, labels = make_blobs(n_samples=1000,
                          #centers=n_classes,
                          centers=np.array([[2, 3], [4, 5], [7, 9]]),
                          random_state=1)
labels = labels.reshape((labels.shape[0],1))
all_data = np.concatenate((data, labels), axis=1)
all_data[:10]
np.savetxt("squirrels.txt", all_data)
all_data[:10]
For some people it might be complicated to understand the combination of reshape and concatenate. Therefore, you can see an extremely simple example in the following code:
import numpy as np
a = np.array( [[1, 2], [3, 4]])
b = np.array( [5, 6])
b = b.reshape((b.shape[0], 1))
print(b)
x = np.concatenate( (a, b), axis=1)
x
file_data = np.loadtxt("squirrels.txt")
data = file_data[:,:-1]
labels = file_data[:,2:]
labels = labels.reshape((labels.shape[0]))
import matplotlib.pyplot as plt
colours = ('green', 'red', 'blue', 'magenta', 'yellow', 'cyan')
n_classes = 3
fig, ax = plt.subplots()
for n_class in range(0, n_classes):
    ax.scatter(data[labels==n_class, 0], data[labels==n_class, 1],
               c=colours[n_class], s=10, label=str(n_class))
ax.set(xlabel='Night Vision',
       ylabel='Fur color from sandish to black, 0 to 10 ',
       title='Sahara Virtual Squirrel')
ax.legend(loc='upper right')
We will train our articifical data in the following code:
from sklearn.model_selection import train_test_split
data_sets = train_test_split(data,
                       labels,
                       train_size=0.8,
                       test_size=0.2,
                       random_state=42 # garantees same output for every run
                      )
train_data, test_data, train_labels, test_labels = data_sets
# import model
from sklearn.neighbors import KNeighborsClassifier
# create classifier
knn = KNeighborsClassifier(n_neighbors=8)
# train
knn.fit(train_data, train_labels)
# test on test data:
calculated_labels = knn.predict(test_data)
calculated_labels
from sklearn import metrics
print("Accuracy:", metrics.accuracy_score(test_labels, calculated_labels))
import numpy as np
import sklearn.datasets as ds
data, labels = ds.make_moons(n_samples=150,
                             shuffle=True,
                             noise=0.19,
                             random_state=None)
data += np.array(-np.ndarray.min(data[:,0]),
                 -np.ndarray.min(data[:,1]))
np.ndarray.min(data[:,0]), np.ndarray.min(data[:,1])
import matplotlib.pyplot as plt
fig, ax = plt.subplots()
ax.scatter(data[labels==0, 0], data[labels==0, 1],
               c='orange', s=40, label='oranges')
ax.scatter(data[labels==1, 0], data[labels==1, 1],
               c='blue', s=40, label='blues')
ax.set(xlabel='X',
       ylabel='Y',
       title='Moons')
#ax.legend(loc='upper right');
We want to scale values that are in a range [min, max] in a range [a, b].
We now use this formula to transform both the X and Y coordinates of data into other ranges:
min_x_new, max_x_new = 33, 88
min_y_new, max_y_new = 12, 20
data, labels = ds.make_moons(n_samples=100,
                             shuffle=True,
                             noise=0.05,
                             random_state=None)
min_x, min_y = np.ndarray.min(data[:,0]), np.ndarray.min(data[:,1])
max_x, max_y = np.ndarray.max(data[:,0]), np.ndarray.max(data[:,1])
#data -= np.array([min_x, 0])
#data *= np.array([(max_x_new - min_x_new) / (max_x - min_x), 1])
#data += np.array([min_x_new, 0])
#data -= np.array([0, min_y])
#data *= np.array([1, (max_y_new - min_y_new) / (max_y - min_y)])
#data += np.array([0, min_y_new])
data -= np.array([min_x, min_y])
data *= np.array([(max_x_new - min_x_new) / (max_x - min_x), (max_y_new - min_y_new) / (max_y - min_y)])
data += np.array([min_x_new, min_y_new])
#np.ndarray.min(data[:,0]), np.ndarray.max(data[:,0])
data[:6]
def scale_data(data, new_limits, inplace=False ):
    if not inplace:
        data = data.copy()
    min_x, min_y = np.ndarray.min(data[:,0]), np.ndarray.min(data[:,1])
    max_x, max_y = np.ndarray.max(data[:,0]), np.ndarray.max(data[:,1])
    min_x_new, max_x_new = new_limits[0]
    min_y_new, max_y_new = new_limits[1]
    data -= np.array([min_x, min_y])
    data *= np.array([(max_x_new - min_x_new) / (max_x - min_x), (max_y_new - min_y_new) / (max_y - min_y)])
    data += np.array([min_x_new, min_y_new])
    if inplace:
        return None
    else:
        return data


data, labels = ds.make_moons(n_samples=100,
                             shuffle=True,
                             noise=0.05,
                             random_state=None)
scale_data(data, [(1, 4), (3, 8)], inplace=True)
data[:10]
fig, ax = plt.subplots()
ax.scatter(data[labels==0, 0], data[labels==0, 1],
               c='orange', s=40, label='oranges')
ax.scatter(data[labels==1, 0], data[labels==1, 1],
               c='blue', s=40, label='blues')
ax.set(xlabel='X',
       ylabel='Y',
       title='moons')

ax.legend(loc='upper right');
import sklearn.datasets as ds
data, labels = ds.make_circles(n_samples=100,
                             shuffle=True,
                             noise=0.05,
                             random_state=None)
fig, ax = plt.subplots()
ax.scatter(data[labels==0, 0], data[labels==0, 1],
               c='orange', s=40, label='oranges')
ax.scatter(data[labels==1, 0], data[labels==1, 1],
               c='blue', s=40, label='blues')
ax.set(xlabel='X',
       ylabel='Y',
       title='circles')
ax.legend(loc='upper right')
print(__doc__)
import matplotlib.pyplot as plt
from sklearn.datasets import make_classification
from sklearn.datasets import make_blobs
from sklearn.datasets import make_gaussian_quantiles
plt.figure(figsize=(8, 8))
plt.subplots_adjust(bottom=.05, top=.9, left=.05, right=.95)
plt.subplot(321)
plt.title("One informative feature, one cluster per class", fontsize='small')
X1, Y1 = make_classification(n_features=2, n_redundant=0, n_informative=1,
                             n_clusters_per_class=1)
plt.scatter(X1[:, 0], X1[:, 1], marker='o', c=Y1,
            s=25, edgecolor='k')
plt.subplot(322)
plt.title("Two informative features, one cluster per class", fontsize='small')
X1, Y1 = make_classification(n_features=2, n_redundant=0, n_informative=2,
                             n_clusters_per_class=1)
plt.scatter(X1[:, 0], X1[:, 1], marker='o', c=Y1,
            s=25, edgecolor='k')
plt.subplot(323)
plt.title("Two informative features, two clusters per class",
          fontsize='small')
X2, Y2 = make_classification(n_features=2, n_redundant=0, n_informative=2)
plt.scatter(X2[:, 0], X2[:, 1], marker='o', c=Y2,
            s=25, edgecolor='k')
plt.subplot(324)
plt.title("Multi-class, two informative features, one cluster",
          fontsize='small')
X1, Y1 = make_classification(n_features=2, n_redundant=0, n_informative=2,
                             n_clusters_per_class=1, n_classes=3)
plt.scatter(X1[:, 0], X1[:, 1], marker='o', c=Y1,
            s=25, edgecolor='k')
plt.subplot(325)
plt.title("Three blobs", fontsize='small')
X1, Y1 = make_blobs(n_features=2, centers=3)
plt.scatter(X1[:, 0], X1[:, 1], marker='o', c=Y1,
            s=25, edgecolor='k')
plt.subplot(326)
plt.title("Gaussian divided into three quantiles", fontsize='small')
X1, Y1 = make_gaussian_quantiles(n_features=2, n_classes=3)
plt.scatter(X1[:, 0], X1[:, 1], marker='o', c=Y1,
            s=25, edgecolor='k')
plt.show()

 Buch kaufen
 Buch kaufen
 Buch kaufen

